[

          {
            "name": "Air - Inline Content - Upper",
            "component": "26908817",
            "insertPoint": "1/4",
            "requiredCountToDisplay": "8"
          },{
            "name": "Air - Inline Content - Middle",
            "component": "26908818",
            "insertPoint": "1/2",
            "requiredCountToDisplay": "8"
          },{
            "name": "Air - Inline Content - Lower",
            "component": "26908819",
            "insertPoint": "100",
            "requiredCountToDisplay": "1"
          }

        ]
| Case study: Neighbouring suburban communities | Kingswood | Upper Hammonds Plains |
|---|
| Market value of average house | $542,020 | $107,380 |
| Current city and provincial tax | $5,908 | $876 |
| City and provincial tax under “reform” | $3,311 | $1,532 |
| City’s share of current taxes | $3,813 | $560 |
| City taxes under “tax reform” | $1,216 | $1,216 |
| Change in city tax | $2,597 lower (-68%) | increases $656 (+117%) |
| | | |
| Note: The “average house” is an amalgamation of 10 houses. Methodology here. | | |
| | | |
| | | |
| Case study: An extremely regressive tax system by design | David & Margaret Fountain, Young Avenue | Bill & Helen Zebedee, Clement Street |
|---|
| Market value of house: | $4,040,300 | $149,700 |
| Capped assessment: | $3,379,900 | $145,500 |
| Present tax system | | |
| City tax bill: | $28,695 | $1,235 |
| Tax per $100 of capped assessment: | 84.9 cents | 84.9 cents |
| Tax per $100 of market value: | 71 cents | 82.5 cents |
| Under “reform” proposal | | |
| Services charged: | all urban | all urban |
| Tax bill: | $1,316 | $1,316 |
| Tax per $100 of market value: | 0.03 cents | 87.9 cents |
| |
| Note: Tax figures reflect only the city’s portion of property tax bills, and do not include the provincial and supplemental educations charges, which remain the same under both scenarios. | | |
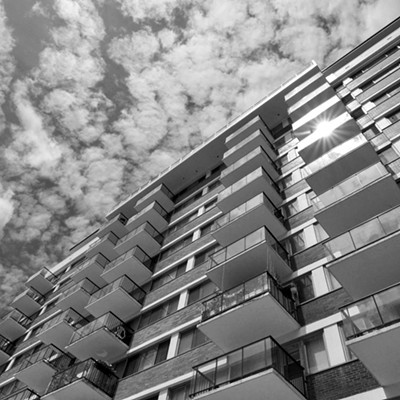
| Case study: How “reform” taxes apartments | |
|---|
| Halifax Peninsula** | Dartmouth** |
| | |
| Quinpool Tower | Marine View Terrace |
| - $96 / unit | + $221 / unit |
| | |
| Fenwick Tower | Westgate Apartments |
| + $55 / unit | + $140 / unit |
| | |
| SouthPoint Apartments | 96 Highfield Park Drive |
| - $10 /unit | + $198 / unit |
| | |
| Ogilvie Apartments | 4 Franklyn Court |
| + $26 / unit | + $258 / unit |
| | |
| | |
| **Based on 2007 figures. |